
The reprint of three articles that spells out the problem.
The Corporate Debt Bubble|

Corporate debt to GDP is at its highest level in all of recorded history.
50% of that debt is BBB, or one level above junk.
Decreased cash flows and less corporate debt demand in a recession will stop buybacks and lead to insolvency in the junk bond market.
This may lead to another wave of bail outs and increased sovereign debt.
Increased sovereign debt will lead to Japanese and European-like economic malaise unless the U.S. creates inflation.
As wages have remained relatively stagnant for decades, credit has become the engine of economic growth in the U.S., and excess credit and leverage the primary driver of recessions. The two charts below demonstrate this process. Real wages have remained stagnant since 1973. Around that time we begin to see increases and violent swings in consumer credit change. The reason? Without wage growth, the credit economy must be pumped up to increase consumption (and therefore GDP).
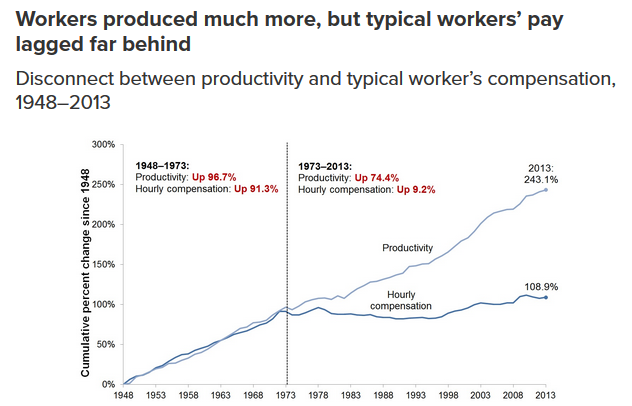 (Source: Economic Policy Institute)
 (Source: Trading Economics)
Home ownership, created with debt, increased drastically before the savings and loan crisis of the 1990s and the subprime mortgage crisis of 2008. When homeowners began defaulting, the crisis shifted to banks. Then credit froze as banks held worthless mortgage backed securities until the government stepped in. Government balance sheets assumed most of the banks’ debt and the Fed provided easy credit and ample liquidity through low interest rates and Quantitative Easing to spurn lending. Thus, the seeds were sewn for the excesses we see today in corporate and sovereign debt.
This article demonstrates how an economic slowdown will likely burst the corporate debt bubble. With limited room for increasing sovereign debt levels, the crisis may shift to currencies.
The Corporate Debt Bubble
This bull market’s excess is undoubtedly in the corporate debt sector. Corporate debt has doubled since the 2008 crisis. Corporate debt to GDP is at its highest level in all of recorded history. Naturally, too much debt lowers your credit quality. This is evident by the fact that roughly 50% of the corporate debt market is BBB, or just one level above junk. The explosion of BBB debt can be seen in the second chart below. AT&T has amassed $191 billion of total debt. Ford has $157 billion of debt but a much less manageable 450% debt/equity ratio. General Electric and General Motors are two other companies with debt levels putting them at risk of downgrade.
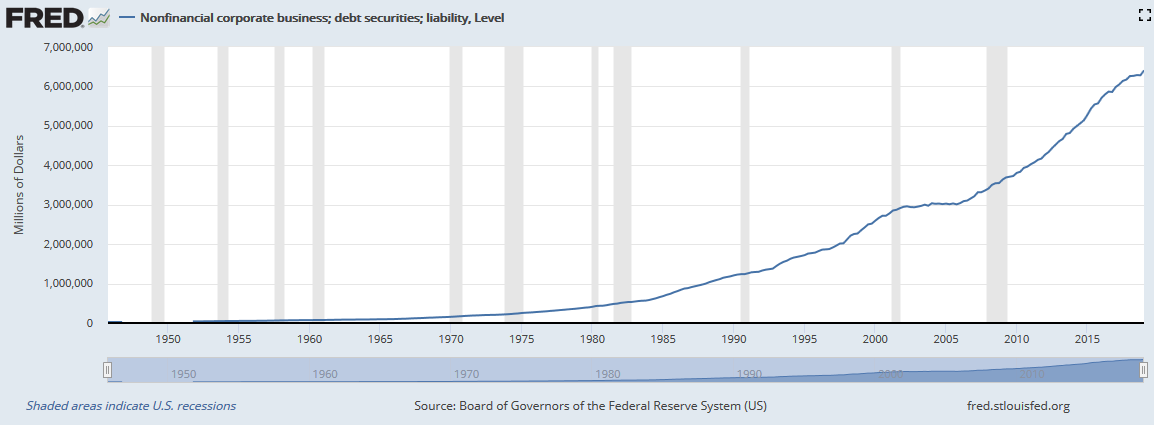 (Source: St. Louis Fed)
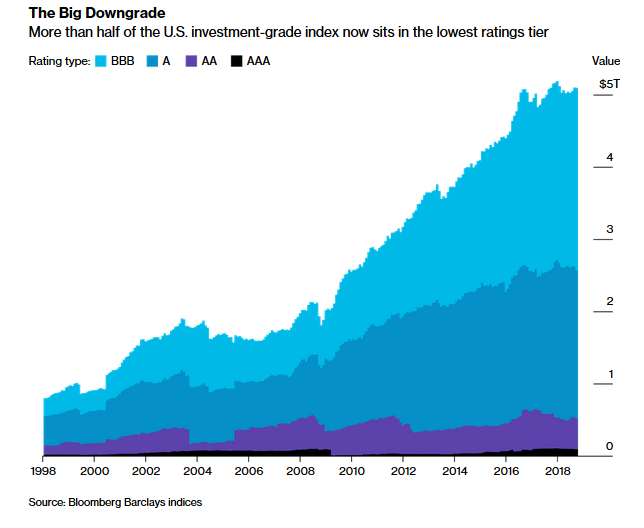 (Source: Bloomberg)
Corporate buybacks through issuing debt and cash flows is propping up equity markets. As the chart below shows, corporations have made up for the reduced demand from institutions (who are net sellers), households, and rest of world. If and when a recession occurs, expect a flight to safety from foreign buyers, pension systems, and financial institutions. This means less buyers of corporate debt and less buybacks.
 (Source: Atlas Wealth Management)
So when cash flows decrease in the next recession, less net buyers of BBB debt in a flight to safety, and many BBB corporations become downgraded to junk (the % depends on the severity of the recession), the share buybacks currently propping up the equity market will come to a screeching halt and nothing will be left to support current equity prices. Additionally, the junk bond market is less than half the size of the BBB market and typically faces a lack of liquidity at the first sign of recession. A nearly illiquid junk bond market cannot absorb a wave of BBB downgrades, especially from blue chip companies listed above. A major downgrade will make the junk bond market insolvent, high yield spreads will widen, and companies that rely on junk debt financing will be at risk of defaulting.
Likelihood of a Recession
With the transportation sector rolling over, reduced consumer spending, reduced semiconductor sales, global PMI at its lowest level in seven years, and the 2s-10s curve only 160 bps from inverting, we are certainly in the midst of a growth rate cycle slowdown. Despite this, the possibility of a recovery still exists with a dovish Fed cutting amidst these warning signs. I do not believe the Federal Reserve can kick this can down the road and prevent recession for another several years. The reason? They told us the probability is low.
The NY Fed probability of recession index has reached 31.4%. Only one time in history has this index reached 30% and a recession not occur in the next twelve months, and that occurred in 1967. A reading above 30% has preceded every other recession in history as the chart below shows. When the NY Fed tells us there is a high probability of recession, investors should listen.
 (Source: NY Fed)
Endgame
The U.S. will be forced to bail out overleveraged corporations. With Japan’s debt to GDP ratio at nearly 250% as a precedent, there is no doubt in my mind that the U.S. can take on more debt to prevent a collapse in the high yield corporate sector. However, two issues come to mind: 1) the political will to bail out large corporations. 2) the economic drag of high debt as interest payments consume a higher portion of federal expenditures. Not to mention the $122 trillion dollars of unfunded liabilities that the U.S. will have to finance with deficit spending.
The U.S. has several options. They can ride this monetary experiment ad infinitum and experience several years or decades of economic malaise like Europe or Japan. They can default on their debt. They can enact austerity to get the budget in order. They can grow out of the debt (decreasing debt as a percentage of growing GDP). Or they can inflate the debt away by monetizing it or devaluing the currency.
In a blog post here, I discuss Ray Dalio’s article on macroeconomic paradigm shifts. He believes in a combination of the above: “So there will have to be some combination of large deficits that are monetized, currency depreciations, and large tax increases.” With Modern Monetary Theory at the forefront of economic debates, this likelihood of this outcome has never seemed higher. I believe the second act of unconventional monetary policy will look something like what Dalio describes above.
Risk and Reward by Asset Class
This hopes to answer the so what. If the U.S. erases its sovereign debt through currency devaluation, the prices of gold and bitcoin will skyrocket. I also firmly believe that long term interest rates will reach zero, becoming a boon for bond prices. Disinflation is highly intact, which is why I’m currently neutral on commodities, yet recommend a portion of one’s portfolio in commodities for diversification. I also recommend long volatility positions as a hedge against sharp downturns.
The Fed’s recession index is too strong a sign to ignore. I recommend being underweight U.S. stocks and am neutral emerging market stocks though long-term bullish. This depends on price action of the U.S. dollar, which I cannot determine with certainty. This dynamic may take years to come to fruition, if at all. Yet the possibility makes gold and bitcoin attractive buys at the moment. With gold and bitcoin price action despite global disinflation, I believe investors are beginning to price in the possibility of currency devaluation.
Fed Adds $63.5 Billion to Financial System in Repo Transaction
Latest transaction seeks to relieve funding pressure in money markets
The Federal Reserve Bank of New York added $63.5 billion to the financial system Monday, using the market for repurchase agreements, or repo, to relieve funding pressure in money markets.
Banks asked for $63.5 billion in overnight reserves, all of which the Fed accepted, offering collateral in the form of U.S. Treasury and mortgage securities.
In the repo market, borrowers seeking cash offer lenders collateral in the form of safe securities—frequently Treasury bonds—in exchange for a short-term loan. The term of these loans can be as short as overnight.
When the Fed adds money to the financial system through the repo market, it is acting as a lender. In typical repo market transactions, lenders can include money-market mutual funds, banks or hedge funds that are seeking to earn a slightly higher rate of interest than what is available from holding very short-term government securities. The borrowers are often banks, securities firms or hedge funds that use the cash to finance positions in the market.
Banks and hedge funds borrow or lend depending on their needs and investment goals.
The Fed began offering repo loans two weeks ago after a shortage of available cash in the financial system led repo rates to climb as financial companies scrambled for overnight funding. The actions marked the first time since the financial crisis that the Fed had taken such actions.
September 2019 Manufacturing ISM® Report On Business®
New Orders, Production, and Employment Contracting
Supplier Deliveries Slowing at a Slower Rate; Backlog Contracting
Raw Materials Inventories Contracting; Customers’ Inventories Too Low
Prices Decreasing; Exports and Imports Contracting
(Tempe, Arizona) — Economic activity in the manufacturing sector contracted in September, and the overall economy grew for the 125th consecutive month, say the nation’s supply executives in the latest Manufacturing ISM® Report On Business®.
The report was issued today by Timothy R. Fiore, CPSM, C.P.M., Chair of the Institute for Supply Management® (ISM®) Manufacturing Business Survey Committee: “The September PMI® registered 47.8 percent, a decrease of 1.3 percentage points from the August reading of 49.1 percent. The New Orders Index registered 47.3 percent, an increase of 0.1 percentage point from the August reading of 47.2 percent. The Production Index registered 47.3 percent, a 2.2-percentage point decrease compared to the August reading of 49.5 percent. The Employment Index registered 46.3 percent, a decrease of 1.1 percentage points from the August reading of 47.4 percent. The Supplier Deliveries Index registered 51.1 percent, a 0.3-percentage point decrease from the August reading of 51.4 percent. The Inventories Index registered 46.9 percent, a decrease of 3 percentage points from the August reading of 49.9 percent. The Prices Index registered 49.7 percent, a 3.7-percentage point increase from the August reading of 46 percent. The New Export Orders Index registered 41 percent, a 2.3-percentage point decrease from the August reading of 43.3 percent. The Imports Index registered 48.1 percent, a 2.1-percentage point increase from the August reading of 46 percent.
“Comments from the panel reflect a continuing decrease in business confidence. September was the second consecutive month of PMI® contraction, at a faster rate compared to August. Demand contracted, with the New Orders Index contracting at August levels, the Customers’ Inventories Index moving toward ‘about right’ territory and the Backlog of Orders Index contracting for the fifth straight month (and at a faster rate). The New Export Orders Index continued to contract strongly, a negative impact on the New Orders Index. Consumption (measured by the Production and Employment indexes) contracted at faster rates, again primarily driven by a lack of demand, contributing negative numbers (a combined 3.3-percentage point decrease) to the PMI® calculation. Inputs — expressed as supplier deliveries, inventories and imports — were again lower in September, due to inventory tightening for the fourth straight month. This resulted in a combined 3.3-percentage point decline in the Supplier Deliveries and Inventories indexes. Imports contraction slowed. Overall, inputs indicate (1) supply chains are meeting demand and (2) companies are continuing to closely match inventories to new orders. Prices decreased for the fourth consecutive month, but at a slower rate.
“Global trade remains the most significant issue, as demonstrated by the contraction in new export orders that began in July 2019. Overall, sentiment this month remains cautious regarding near-term growth,” says Fiore.
Of the 18 manufacturing industries, three reported growth in September: Miscellaneous Manufacturing; Food, Beverage & Tobacco Products; and Chemical Products. The 15 industries reporting contraction in September — in the following order — are: Apparel, Leather & Allied Products; Printing & Related Support Activities; Wood Products; Electrical Equipment, Appliances & Components; Textile Mills; Paper Products; Fabricated Metal Products; Plastics & Rubber Products; Petroleum & Coal Products; Primary Metals; Transportation Equipment; Nonmetallic Mineral Products; Machinery; Furniture & Related Products; and Computer & Electronic Products.
WHAT RESPONDENTS ARE SAYING…
- “Second month in a row in which shipments have outpaced new orders.” (Computer & Electronic Products)
- “Continued softening in the global automotive market. Trade-war impacts also have localized effects, particularly in select export markets. Seeing warehouses filling again after what appeared to be a short reduction of demand.” (Chemical Products)
- “Business outlook remains cautious. Orders seem to be decreasing, but luckily not as sharp of a decrease as we were expecting.” (Transportation Equipment)
- “Chinese tariffs going up are hurting our business. Most of the materials are not made in the U.S. and made only in China.” (Food, Beverage & Tobacco Products)
- “General market is slowing even more than a normal fourth-quarter slowdown.” (Fabricated Metal Products)
- “Demand softening on some product lines, backlogs have reduced, and dealer inventories are growing.” (Machinery)
- “Business has been flat for us. Year-over-year growth has slowed dramatically.” (Miscellaneous Manufacturing)
- “We have seen a reduction in sales orders and, therefore, a lower demand for products we order. We have also reduced our workforce by 10 percent.” (Plastics & Rubber Products)
- “Incoming sales are sluggish for this time of year.” (Furniture & Related Products)
- “Economy seems to be softening. The tariffs have caused much confusion in the industry.” (Electrical Equipment, Appliances & Components)
MANUFACTURING AT A GLANCE
SEPTEMBER 2019
| Index | Series Index Sep | Series Index Aug | Percentage Point Change | Direction | Rate of Change | Trend* (Months) |
|---|---|---|---|---|---|---|
| PMI® | 47.8 | 49.1 | -1.3 | Contracting | Faster | 2 |
| New Orders | 47.3 | 47.2 | +0.1 | Contracting | Slower | 2 |
| Production | 47.3 | 49.5 | -2.2 | Contracting | Faster | 2 |
| Employment | 46.3 | 47.4 | -1.1 | Contracting | Faster | 2 |
| Supplier Deliveries | 51.1 | 51.4 | -0.3 | Slowing | Slower | 43 |
| Inventories | 46.9 | 49.9 | -3.0 | Contracting | Faster | 4 |
| Customers’ Inventories | 45.5 | 44.9 | +0.6 | Too Low | Slower | 36 |
| Prices | 49.7 | 46.0 | +3.7 | Decreasing | Slower | 4 |
| Backlog of Orders | 45.1 | 46.3 | -1.2 | Contracting | Faster | 5 |
| New Export Orders | 41.0 | 43.3 | -2.3 | Contracting | Faster | 3 |
| Imports | 48.1 | 46.0 | +2.1 | Contracting | Slower | 3 |
| OVERALL ECONOMY | Growing | Slower | 125 | |||
| Manufacturing Sector | Contracting | Faster | 2 | |||
Manufacturing ISM® Report On Business® data is seasonally adjusted for the New Orders, Production, Employment and Supplier Deliveries Indexes.
*Number of months moving in current direction.
Carl M. Birkelbach
ADDITIONAL INFORMATION IS AVAILABLE UPON REQUEST
Carl does not offer investment advice, but merely his own personal opinion. This report has been prepared from original sources and data we believe reliable but make no representations as to the accuracy or completeness. Carl, his affiliates and subsidiaries and/or their officers and employees may from time to time acquire, hold or sell a position in securities. Past performance is no guarantee of future success. Upon request, we will supply additional information. CarlBis@aol.com
